I finished my sieving analysis and writeup for it. Below is the python script that I used to plot the data shown in the graphs below. I don’t know why but wordpress is removing my white space formatting.


# Import statements.
import matplotlib.pyplot as plt
from matplotlib import rcParams
# Change the figure size and font used.
rcParams['font.sans-serif'] = 'Arial'
rcParams['figure.figsize'] = [3.27, 3.27]
rcParams['xtick.direction'] = 'out'
rcParams['ytick.direction'] = 'out'
# Input data. Values are in grams.
pharmatose150M = [ 205, 165, 103, 90, 85, 81, 81, 78, 75 ]
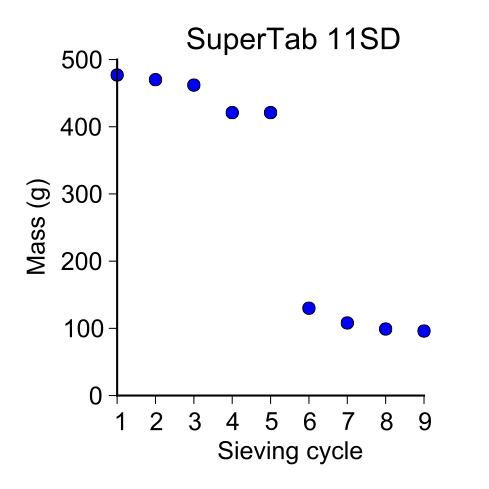
supertab11SD = [ 477, 470, 462, 421, 421, 130, 108, 99, 96 ]
supertab30GR = [ 246, 239, 236, 234, 218, 209, 202, 200 ]
# Generate the x-axis.
sieve_cycle = [ 1, 2, 3, 4, 5, 6, 7, 8, 9 ]
# Plot the data.
def plot_data(x, y, marker_type, marker_size, x_label, y_label, title):
""" Plots the input data.
x = x-data
y = y-data
marker_type = Marker type of the plot.
marker_size = Marker size of the plot.
x_label = x-axis label.
y_label = y-axis label.
title = Title of the plot.
"""
# Initialize a figure.
fig = plt.figure()
ax = fig.add_subplot(1, 1, 1)
# Add labels.
ax.set_xlabel(x_label)
ax.set_ylabel(y_label)
ax.set_title(title)
# Fix the x-axis limit.
ax.set_xlim([1, 10])
# Modify the spines so that the top and right spines are not visible.
ax.xaxis.set_ticks_position('bottom')
ax.yaxis.set_ticks_position('left')
ax.spines['right'].set_visible(False)
ax.spines['top'].set_visible(False)
ax.spines['left'].set_smart_bounds(True)
ax.spines['bottom'].set_smart_bounds(True)
#ax.spines['left'].set_position(('axes', -0.01))
# Plot the data.
data = ax.plot(x, y, marker_type, marker_size)
for artist in data:
artist.set_clip_on(False)
fig.tight_layout()
fig.savefig(title.lower().replace(' ', '') + '.pdf')
plot_data(sieve_cycle, pharmatose150M, 'o', 3, 'Sieve cycle', 'Mass (g)',
'Pharmatose 150M')
plot_data(sieve_cycle, supertab11SD, 'o', 3, 'Sieve cycle', 'Mass (g)',
'SuperTab 11SD')
plot_data(sieve_cycle[:-1], supertab30GR, 'o', 3, 'Sieve cycle', 'Mass (g)',
'SuperTab 30GR')
